Sample deliverable — spatial
A full spatial transcriptomics analysis run on a public 10x Visium section (human lymph node), so you can judge the work before sending anything. Every number was computed by the pipeline.
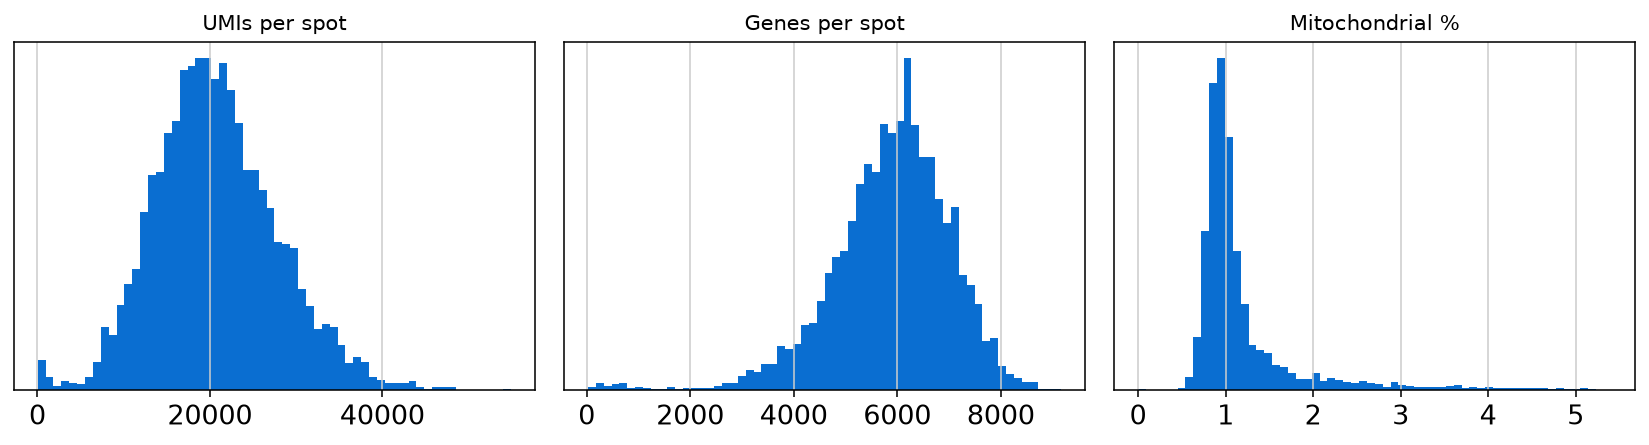
1 · Per-spot quality control
2 · Spatial domains
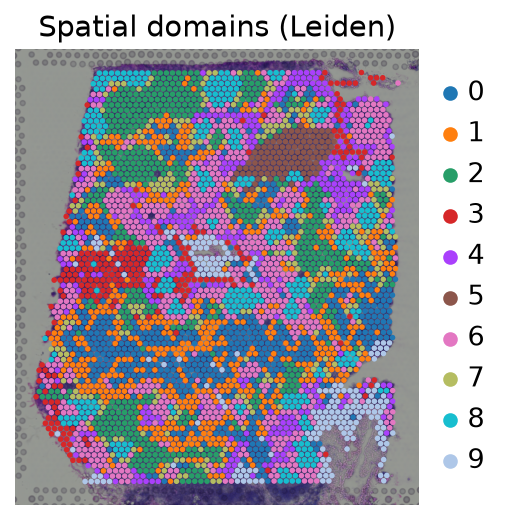
Unsupervised clustering mapped back onto the tissue. These are regions, not cell types — a distinction we keep explicit, because calling Visium spots "cells" is the most common error in spatial papers.
| Domain | Spots | Share |
|---|---|---|
| Domain 6 | 678 | 16.8% |
| Domain 1 | 601 | 14.9% |
| Domain 0 | 579 | 14.4% |
| Domain 2 | 578 | 14.4% |
| Domain 8 | 383 | 9.5% |
| Domain 4 | 360 | 8.9% |
| Domain 7 | 272 | 6.8% |
| Domain 3 | 248 | 6.2% |
| Domain 9 | 209 | 5.2% |
| Domain 5 | 117 | 2.9% |
3 · Spatially variable genes
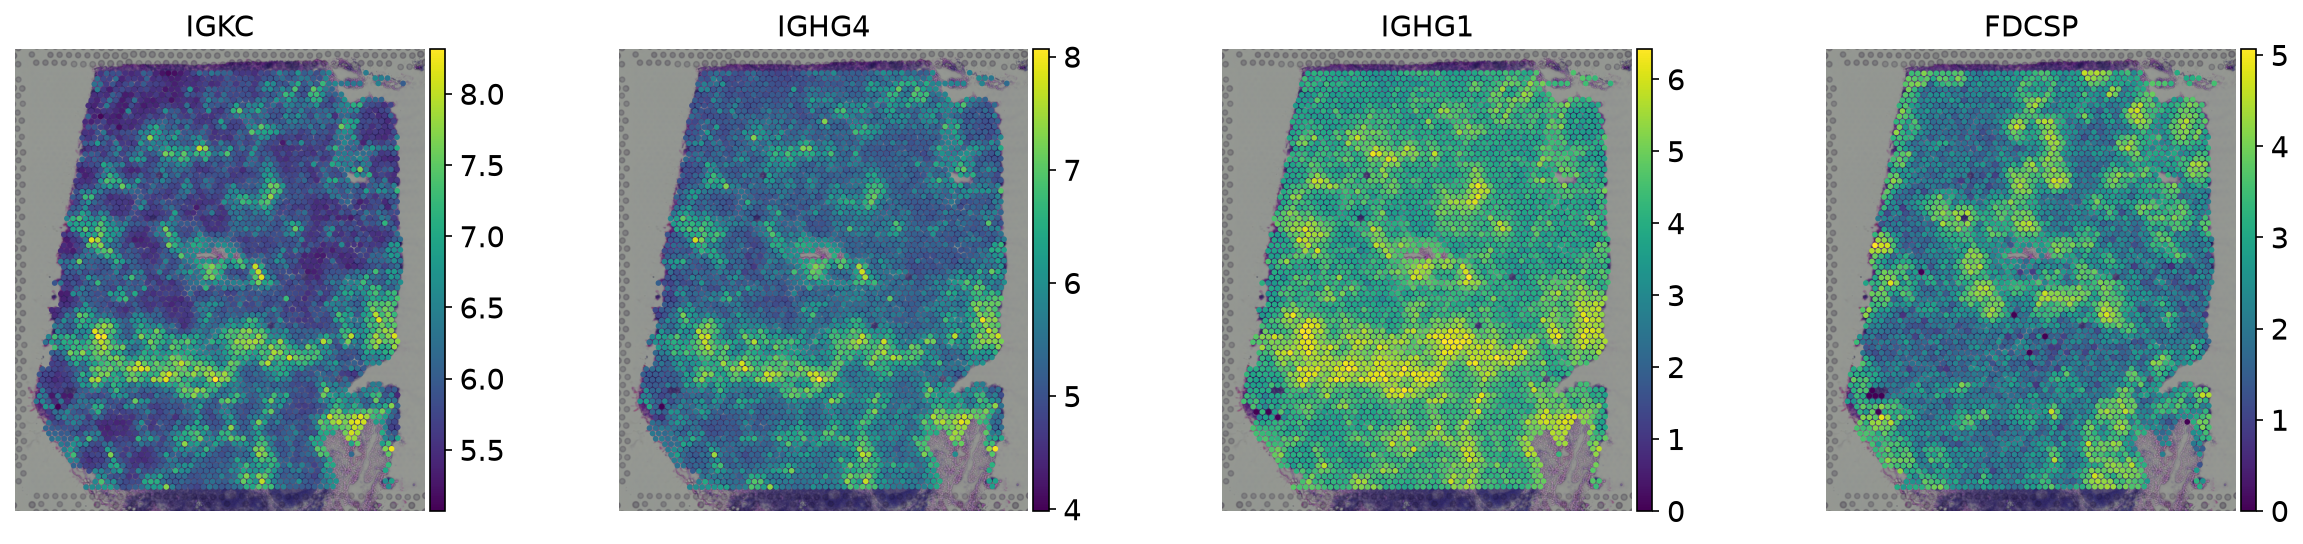
Ranked by spatial autocorrelation (Moran's I). In this lymph node section
the top hits are immunoglobulin genes from plasma-cell rich regions, FDCSP (follicular dendritic
cells, germinal centres) and CCL21 (T-cell zone) — an architecture a pathologist would recognise,
recovered without being told what to look for.
| Gene | Moran's I |
|---|---|
IGKC | 0.878 |
IGHG4 | 0.853 |
IGHG1 | 0.829 |
FDCSP | 0.748 |
CCL21 | 0.681 |
IGHG2 | 0.656 |
CR2 | 0.649 |
CXCL13 | 0.599 |
CLU | 0.595 |
JCHAIN | 0.558 |
4 · Sequencing depth across the section
What a full spatial project adds
- Cell-type deconvolution of each spot against a matched single-cell reference, with the reference stated.
- Neighbourhood / niche statistics against a null model that preserves tissue shape.
- Comparison across sections and conditions, with section treated as the unit of replication.
- Overlays on the H&E image, results tables, the processed object, and the code that produced everything.
→ Get a quote for your sections · See the single-cell sample