Sample deliverable
A complete single-cell analysis, run end to end on a public dataset (10x Genomics PBMC 3k) so you can judge the work before you send us anything. Every number below was computed by the pipeline — nothing here is illustrative.
1 · Quality control
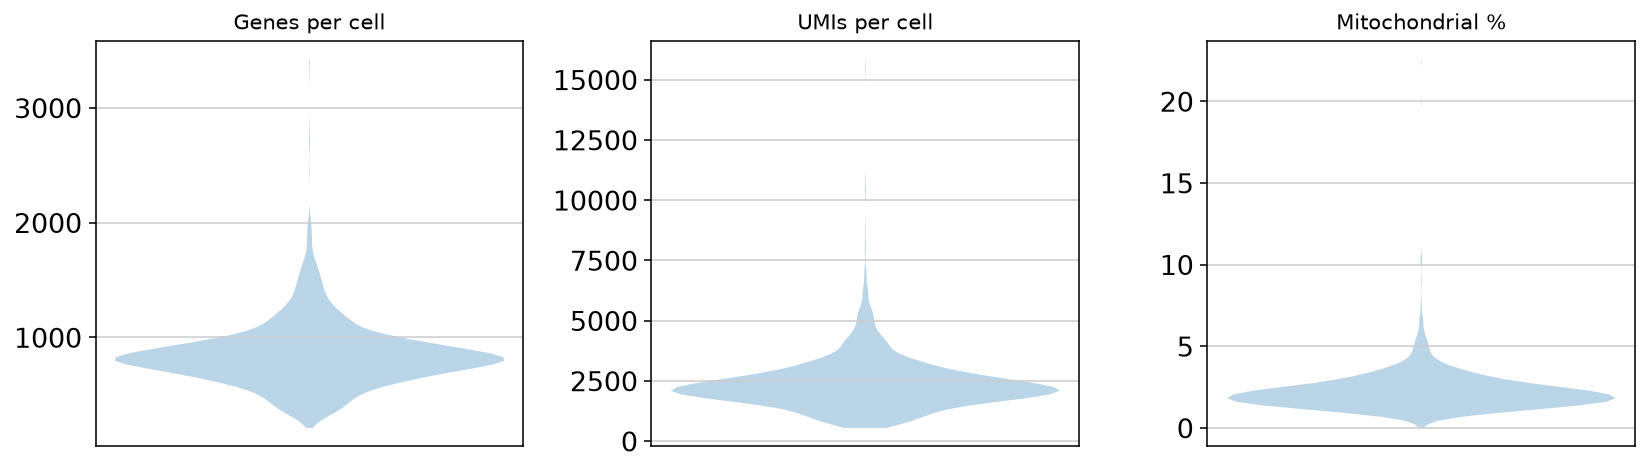
Per-cell distributions before filtering. Cells with <200 genes, >2,500 genes or >5% mitochondrial reads were removed.
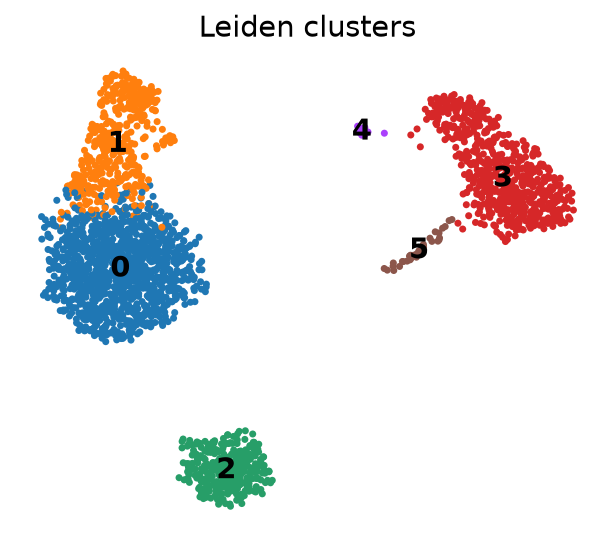
2 · Clustering
3 · Cell-type annotation
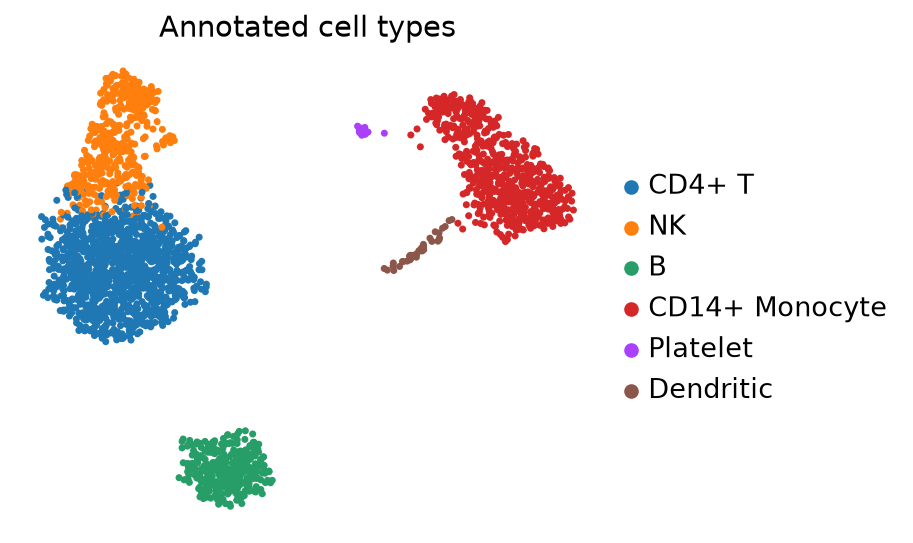
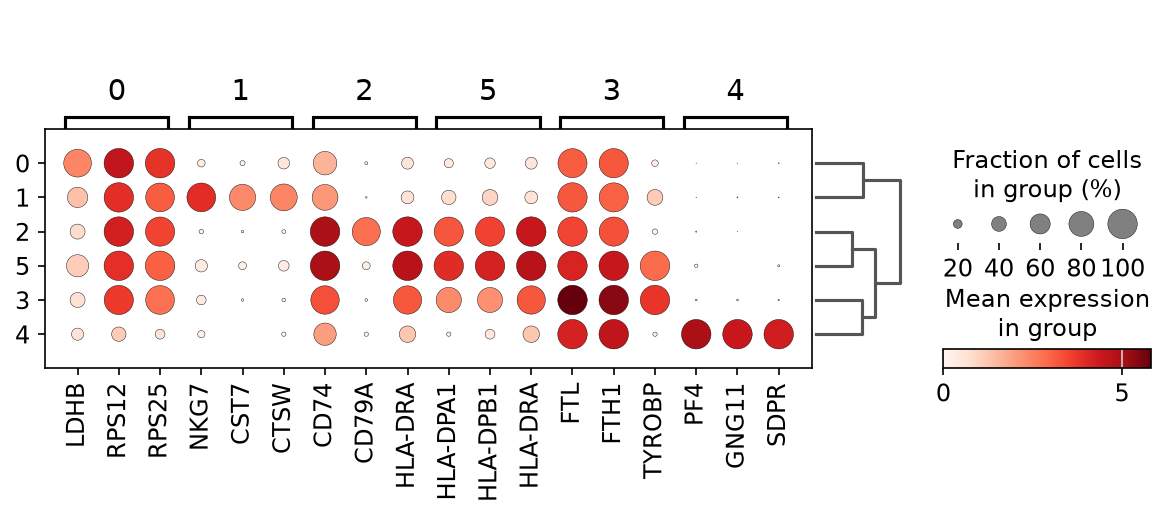
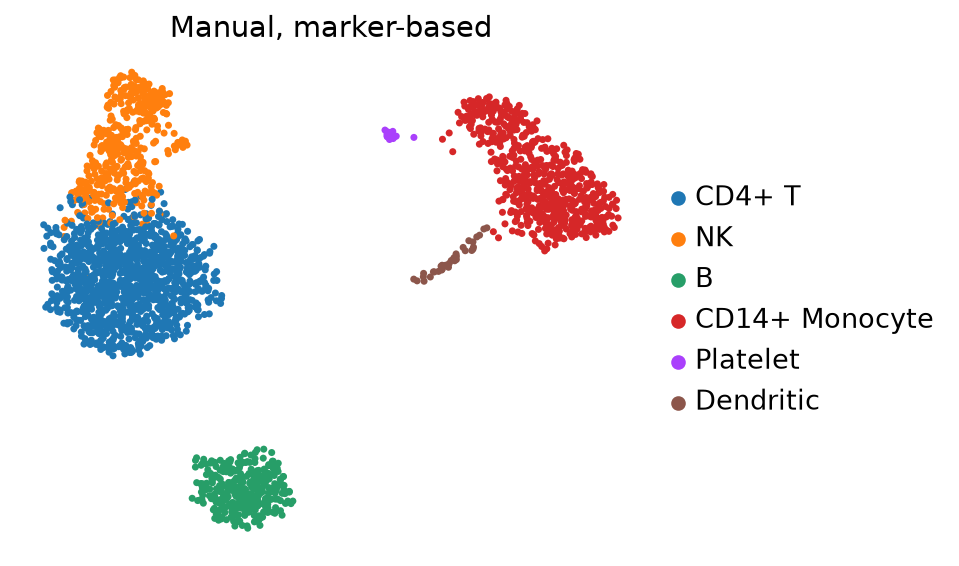
Clusters annotated from canonical marker panels, then checked against the ranked marker genes of each cluster.
| Cell type | Cells | Share |
|---|---|---|
| CD4+ T | 1193 | 45.2% |
| CD14+ Monocyte | 635 | 24.1% |
| NK | 422 | 16.0% |
| B | 340 | 12.9% |
| Dendritic | 35 | 1.3% |
| Platelet | 13 | 0.5% |
4 · Marker genes
5 · Independent check: automated annotation, run blind
Marker-based labels are only as good as the person choosing the markers, so we run a reference-based classifier that never sees them — here CellTypist Immune_All_Low (public) — and compare. On this dataset the two methods agree on 6 of 6 clusters at the lineage level, and within every cluster the classifier assigned the same label to 100% of cells. Where the two disagree, that cluster gets a broader label and a sentence in the results rather than a confident name.
| Cluster | Cells | Marker-based | Automated (blind) | Within-cluster consistency |
|---|---|---|---|---|
| 0 | 1193 | CD4+ T | Tcm/Naive helper T cells | 100% |
| 1 | 422 | NK | CD16+ NK cells | 100% |
| 2 | 340 | B | B cells | 100% |
| 3 | 635 | CD14+ Monocyte | Classical monocytes | 100% |
| 4 | 13 | Platelet | Megakaryocytes/platelets | 100% |
| 5 | 35 | Dendritic | DC | 100% |
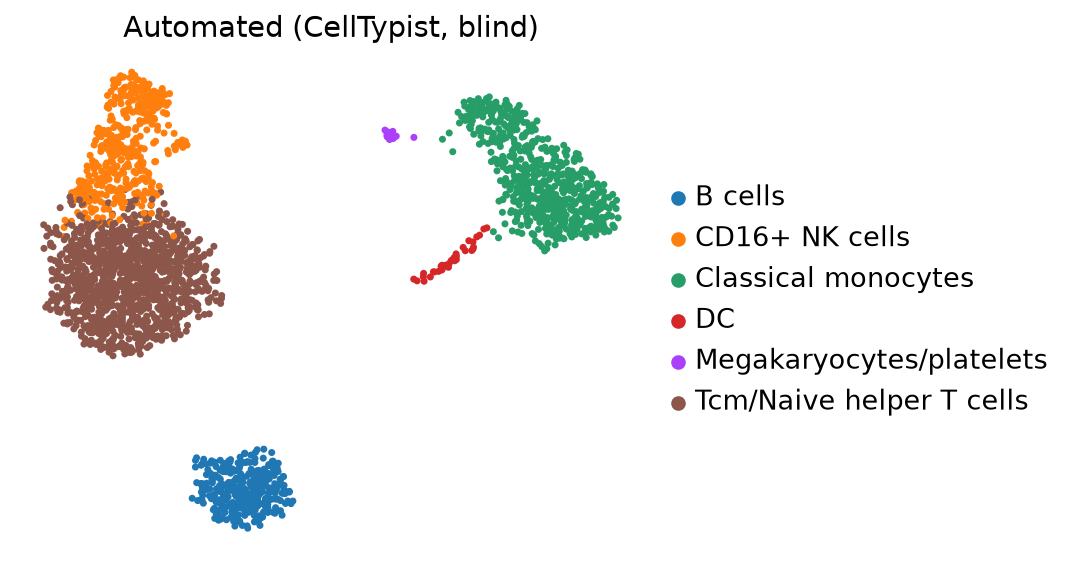
This is the part most analyses skip. It costs an hour and it is the single best defence against the reviewer question "how do you know these are cell type X?" — the method is written up here.
What you would receive
- This report as HTML + PDF, with the methods paragraph written for a manuscript.
- Publication-ready figures at 300 dpi (PNG + vector), each regenerable.
- Results tables: per-cluster markers, cell-type composition, QC metrics per sample.
- The processed object (h5ad / Seurat) plus the exact script and parameters used.