Sample deliverable — the reviewer response
Two comments come back on almost every single-cell manuscript. Neither is answered by argument; both are answered by running something and reporting the number. Here they are, worked through on public data (public 10x Genomics PBMC 3k) exactly as they would go into a rebuttal.
Comment 1 — “The QC thresholds appear arbitrary.”
The reviewer is not asking for different thresholds. They are asking whether your conclusions depend on them. So we re-run the whole pipeline at two alternative threshold sets and report what changes.
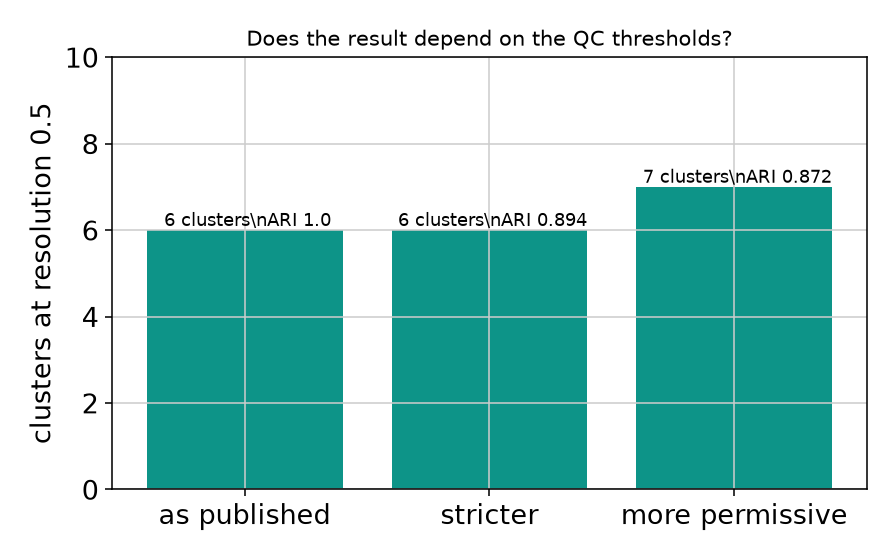
| Run | Thresholds | Cells | Clusters | ARI vs published | Canonical markers recovered |
|---|---|---|---|---|---|
| as published | genes 200–2500, mito <5% | 2,638 | 6 | 1 | 6 |
| stricter | genes 300–2000, mito <3% | 2,246 | 6 | 0.894 | 6 |
| more permissive | genes 150–4000, mito <15% | 2,698 | 7 | 0.872 | 7 |
What this particular run actually showed
Cluster structure is stable (ARI 0.894 and
0.872 against the published thresholds) — but the permissive run recovers
one extra cluster and with it PPBP, the platelet marker, which the stricter filter removes
entirely. The strict run loses a real, small population.
That is the honest answer to the comment, and it is more useful than "our thresholds are standard": the main conclusions do not move, and one rare population is threshold-dependent, so it is reported with that caveat rather than as a clean finding.
How it goes into the rebuttal
Comment 2 — “Were doublets identified and removed?”
A gene-count ceiling is not doublet handling. We run a detector, report the expected and observed rates, and show where the doublets sit.
| Cluster | Predicted doublets |
|---|---|
| Cluster 0 | 0.17% |
| Cluster 1 | 3.82% |
| Cluster 2 | 1.88% |
| Cluster 3 | 0.24% |
| Cluster 4 | 8.33% |
| Cluster 5 | 0% |
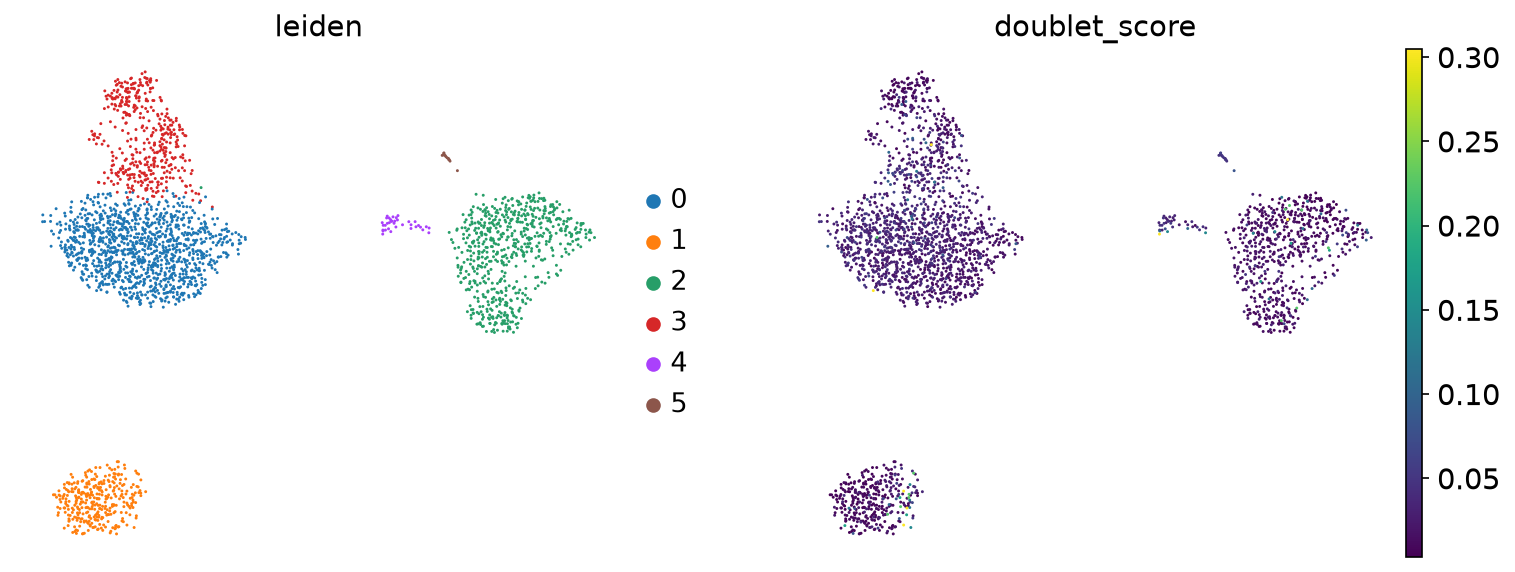
Detected rate sits below the rate expected from loading, and the doublets are not spread evenly — cluster 4 carries 8.33% of them. A cluster that concentrated doublets at several times the background rate would be a cluster to re-examine before calling it a novel state, and that is exactly the check the reviewer is asking for.
Why this service exists
Revision deadlines are short, the original analyst has often moved on, and the comments usually require re-running work rather than rewriting text. We reproduce the existing analysis, run what is being asked for, and hand back both the figures and the paragraphs — with the code, so the next round costs nothing extra. Indicative price for this tier is $450–1800, fixed in writing before we start.
→ Send us the comments · the five requests reviewers actually make · the script that produced this page