Sample deliverable — cell–cell communication
Ligand–receptor analysis is the module most often over-claimed in single-cell papers. This is how we run it so the result survives review: on public data (GEO GSE96583 (Kang et al. 2018) — PBMC, control vs IFN-β), comparing two conditions rather than reading absolute scores, with a check against known biology.
1 · Why comparison, not absolute scores
A high ligand–receptor score means the ligand gene is expressed in one population and the receptor gene in another. It does not show the two cells ever touched, that the protein was translated, or that the receptor was engaged. "This pathway is active" is therefore not supportable from this analysis. "This pathway is stronger in treated than in control" is — because the same technical limitations apply to both sides and cancel.
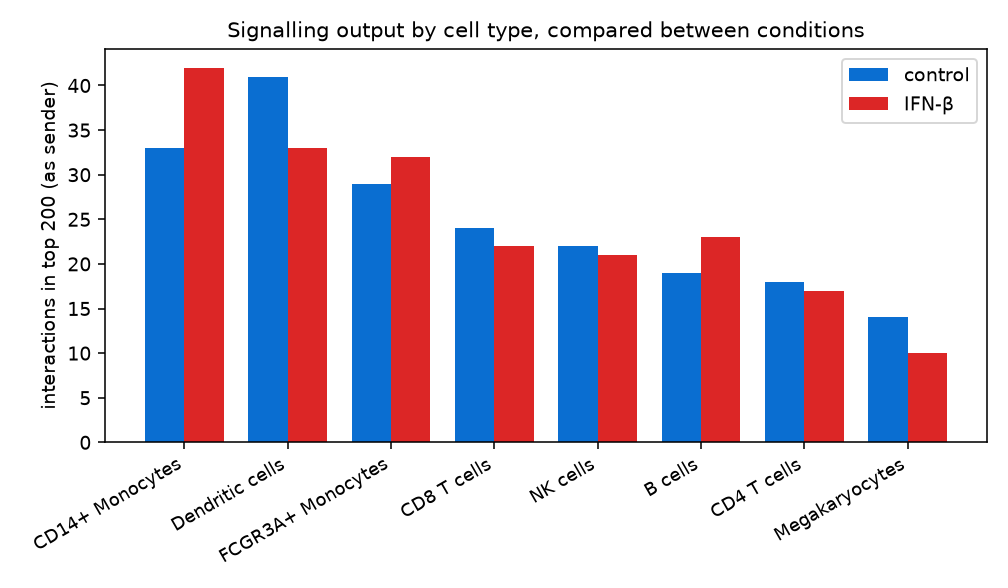
2 · Signalling output by cell type
3 · What changes after stimulation
| Interaction gained after IFN-β | aggregate rank |
|---|---|
| Dendritic cells → CD8 T cells | HLA-DRA-LAG3 | 0.00336 |
| CD14+ Monocytes → FCGR3A+ Monocytes | ICAM1-SPN | 0.00461 |
| CD14+ Monocytes → Dendritic cells | TNFSF13B-HLA-DPB1 | 0.00557 |
| CD14+ Monocytes → FCGR3A+ Monocytes | CD274-CD80 | 0.00921 |
| CD14+ Monocytes → CD14+ Monocytes | CCL2-CCR1 | 0.00975 |
| CD14+ Monocytes → FCGR3A+ Monocytes | PTPN6-CLEC12A | 0.0138 |
| CD14+ Monocytes → CD14+ Monocytes | CCL8-CCR1 | 0.0147 |
| CD14+ Monocytes → FCGR3A+ Monocytes | HEBP1-FPR3 | 0.0184 |
| FCGR3A+ Monocytes → FCGR3A+ Monocytes | ICAM1-SPN | 0.023 |
| Dendritic cells → CD8 T cells | HLA-DRB1-LAG3 | 0.0237 |
| B cells → CD8 T cells | HLA-DRA-LAG3 | 0.0242 |
| CD14+ Monocytes → CD14+ Monocytes | CD274-CD80 | 0.0276 |
4 · The check
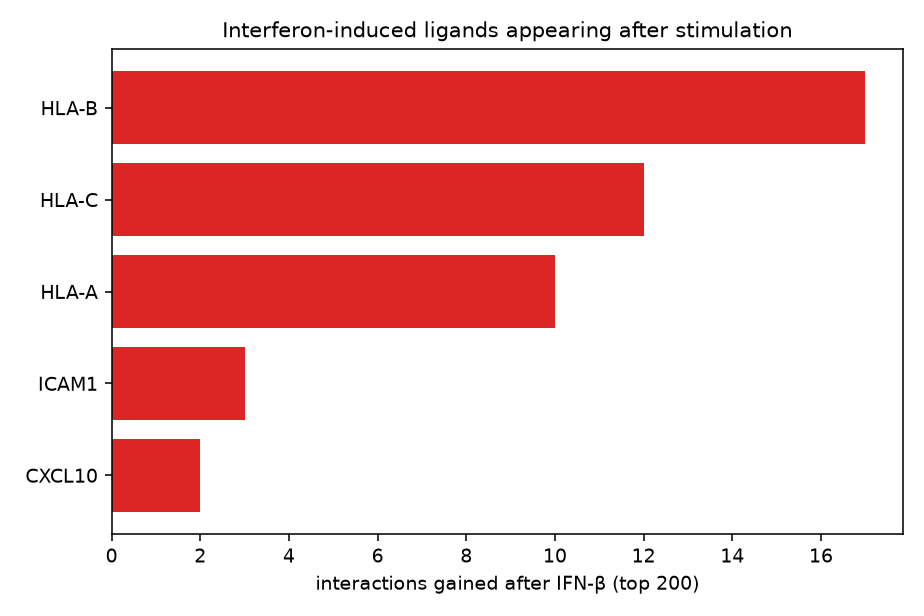
Interferon-β has a known signature: chemokine induction and MHC class I upregulation. Among the interactions gained after stimulation, the ligands include CXCL10, HLA-A, HLA-B, HLA-C, ICAM1 — chemokine CXCL10, adhesion molecule ICAM1 and MHC class I genes. The analysis recovered the known response without being told to look for it, which is the minimum bar before anyone reports an unexpected interaction from the same table.
How we report this on a real project
- As a comparison between conditions, with the direction stated, never as a list of "active pathways".
- With cell numbers per population shown, because rare clusters produce unstable scores.
- With the tool, version and interaction database named — different databases disagree, and a hit present in only one is weak evidence.
- Phrased as candidate interactions for testing, with a sentence on what would confirm the top one (spatial adjacency, protein-level validation, or perturbation).
- The script is published: see the code. Background: what these tools can and cannot tell you.