Sample deliverable — differential abundance
"Cell type X increased after treatment" is one of the most commonly reported single-cell findings and one of the easiest to manufacture. Here is the same dataset (GEO GSE96583 (Kang et al. 2018) — 8 donors, control vs IFN-β, 6 h stimulation) analysed both ways.
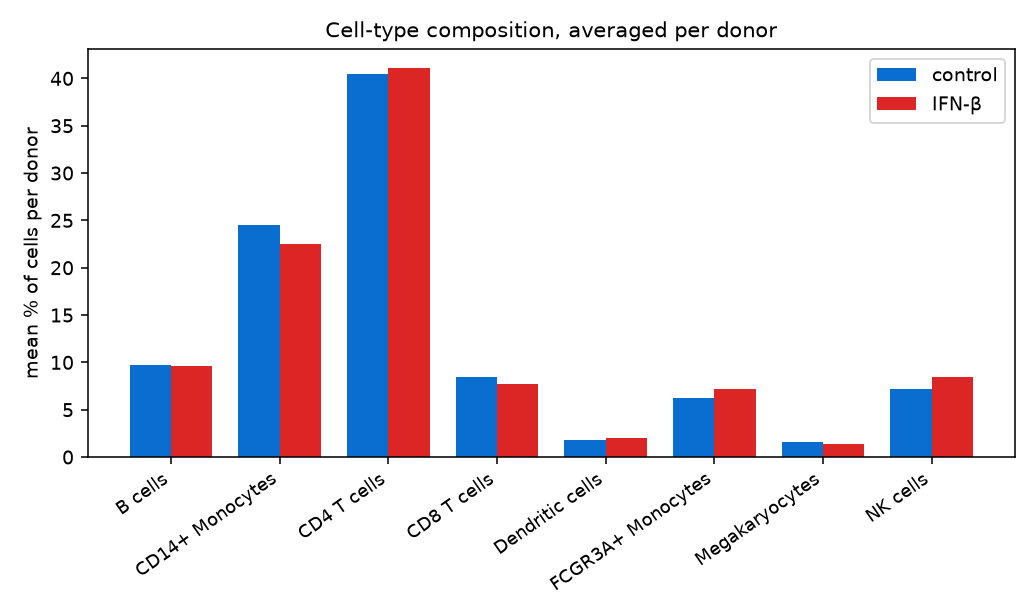
1 · Composition, averaged per donor
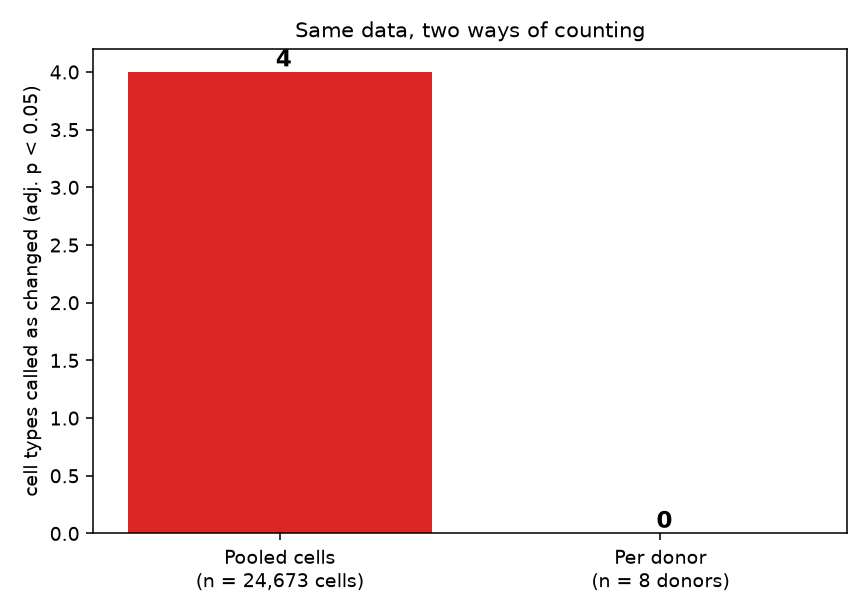
2 · The same data counted two ways
| Cell type | Control | IFN-β | adj. p — pooled cells | adj. p — per donor |
|---|---|---|---|---|
| B cells | 9.73% | 9.66% | 1 | 1 |
| CD14+ Monocytes | 24.54% | 22.53% | 0.023 ✓ | 0.31 |
| CD4 T cells | 40.46% | 41.06% | 1 | 1 |
| CD8 T cells | 8.49% | 7.71% | 0.032 ✓ | 0.12 |
| Dendritic cells | 1.75% | 2.05% | 1 | 1 |
| FCGR3A+ Monocytes | 6.25% | 7.14% | 0.019 ✓ | 0.44 |
| Megakaryocytes | 1.58% | 1.43% | 1 | 1 |
| NK cells | 7.2% | 8.43% | 0.002 ✓ | 0.62 |
Pooling every cell into one contingency table treats 24,673 cells as 24,673 independent observations. At that sample size a difference of one or two percentage points becomes "significant" — which is how 4 cell types end up reported as changed. Testing the same question at the level that actually varies, the donor, with each person compared against themselves, none of them survives.
3 · Is zero the right answer?
In this experiment, yes — and that is the point. PBMCs stimulated for six hours in vitro have no opportunity to change composition; the cells were counted, not recruited. A method that reports composition shifts in an experiment where none can occur will also report them where none exist in your data. The honest deliverable here is a negative result, stated clearly, with the effect sizes shown so a reader can judge for themselves.
What we do on a real project
- Proportions computed per subject, never pooled across a group.
- A paired or mixed-model test at subject level; for designs with more structure, a compositional method (scCODA, propeller) with the reference cell type stated.
- Effect sizes reported alongside p-values, because a real 1% shift and a real 20% shift are different findings.
- Negative results reported as negative results.
- The script, so you can re-run it: see the code.